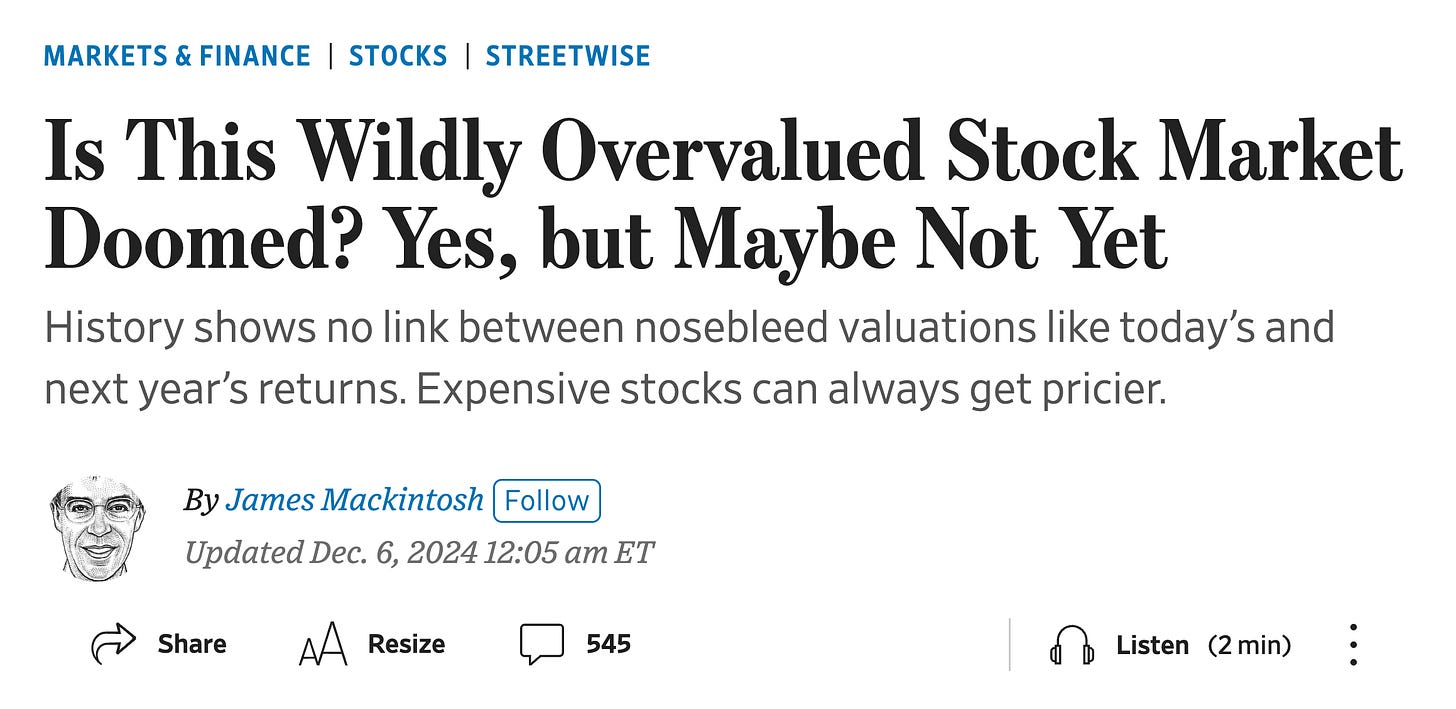
Headlines are rife with warnings about the "wildly overvalued" state of the US stock market, often pointing to historical averages and lofty metrics to support these claims.
For many, the S&P 500’s current valuation suggests we’re on the brink of disappointing returns.
But a deeper look may reveal a more nuanced story.
In this post, I’ll explain why the S&P 500 might not be as overvalued as it seems—and why comparing today’s market to the past can be misleading.
Are Valuation Multiples Telling the Full Story?
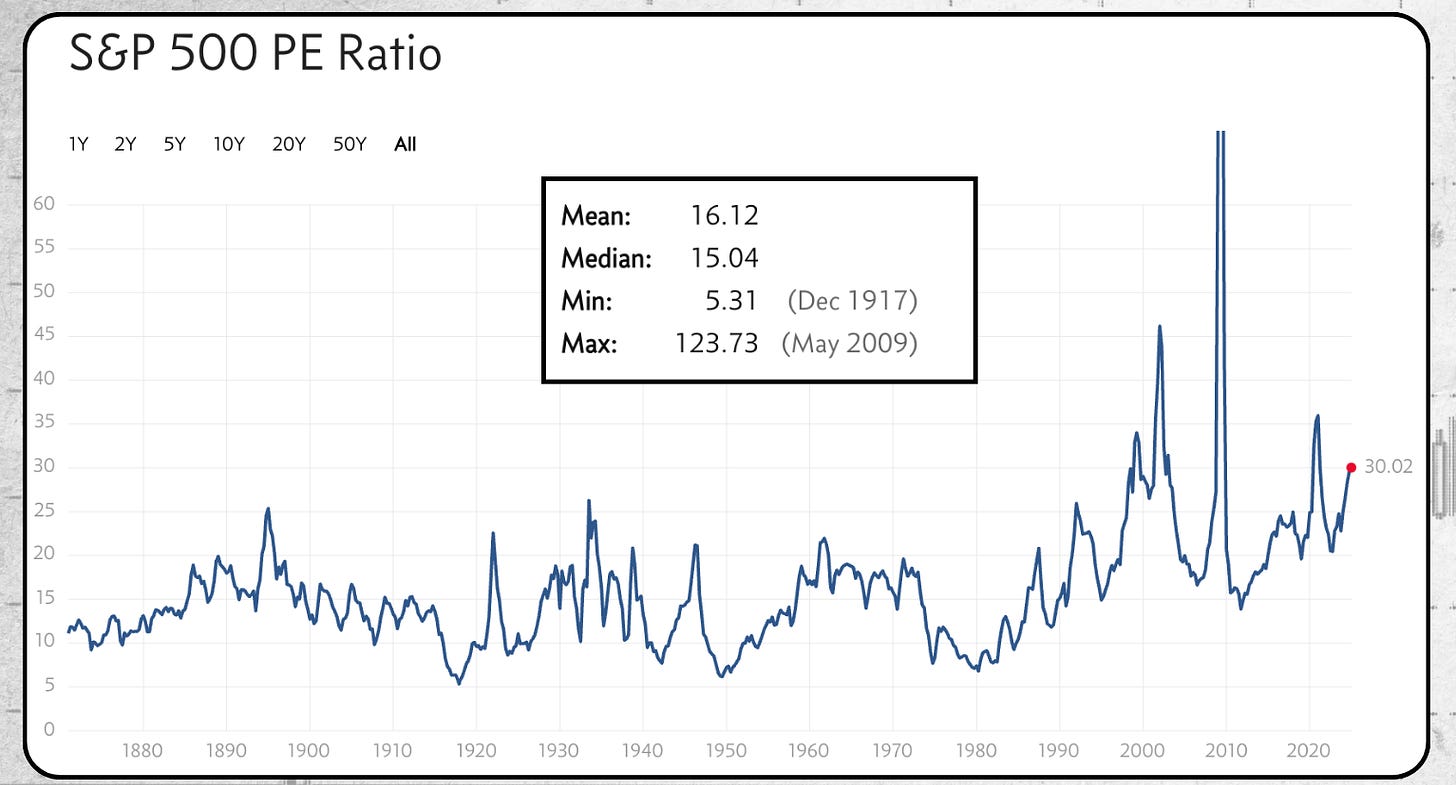
At a glance, the data paints a sobering picture. As of today, the S&P 500’s price-to-earnings (P/E) ratio hovers around 30, nearly double its historical mean of 16.
If you base your assessment solely on this, it’s easy to conclude the market is overpriced.
However, valuation metrics like P/E ratios are just one piece of the puzzle. They’re a shorthand for deeper valuation work, not a comprehensive analysis.
To truly understand the market’s valuation, we need to dig into the factors driving these multiples.
Are they inflated by speculative exuberance (that may be partly true), or is there a structural reason why the S&P 500 deserves its current premium?
Free Cash Flow Margins: A Fundamental Transformation
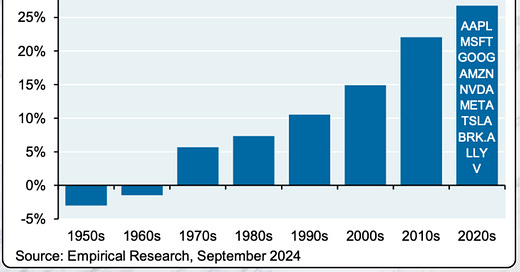
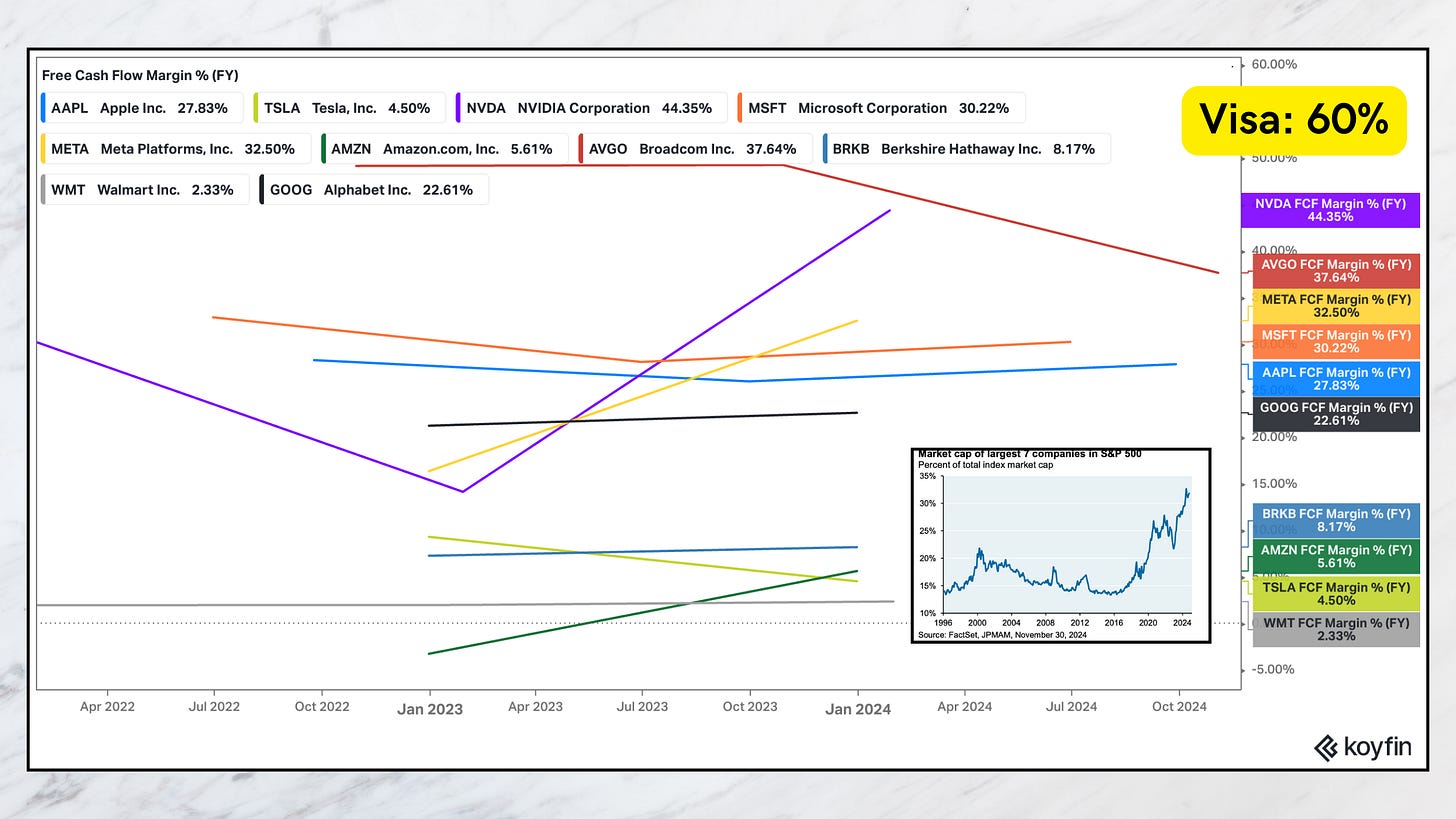
One of the most compelling pieces of evidence comes from a chart featured in a recent J.P. Morgan report. It highlights the dramatic improvement in free cash flow (FCF) margins among the 10 largest companies in the S&P 500.
In the 1970s and 1980s, FCF margins for these companies were below 10%.
Today, the same group boasts margins exceeding 25%.
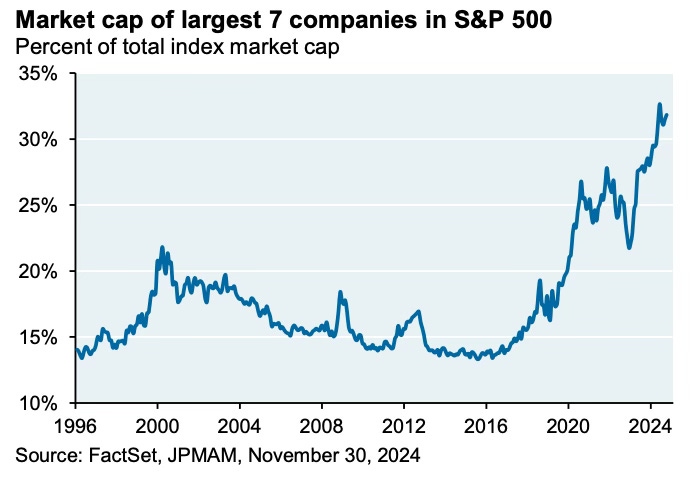
Importantly, the ten largest companies of the S&P 500 represent a much larger weight of the index than they did in the past.
The changes in profitability speak volumes about the structural changes in the quality of the businesses dominating US stock indices.
Companies like Visa (60% FCF margin), Microsoft, and Meta (30%-40% range) have set a new standard for profitability and business efficiency.
Why Free Cash Flow Margins Matter
Free cash flow is the lifeblood of any business—it’s the cash left over after all expenses, including capital expenditures, have been accounted for.
“As a young(er) investment analyst, I once met with the CFO of a large US West Coast bank. I was anxious beforehand, it is not easy for a young man to hold his own with a senior executive of any business, let alone one as opaque as a bank. I forget which question I asked, no doubt it was cloaked in the latest investment buzzwords of the day but, at any rate, it was so overly complicated that it elicited the following response, ‘Look, son, at the end of the day it is all about cash-in, and cash-out’. Oh dear! Well, the put down could have been worse, and probably deserved to be worse. That was a lesson learnt: keep it simple, it is all about cash-in, and cash-out.” - Nick Sleep
High FCF margins mean a company has more flexibility to reinvest in growth, return capital to shareholders, or weather economic downturns, justifying a higher valuation multiple.
For some investors, this may be a bit of an oversimplification. After all, low-margin businesses like Costco with high inventory turnovers can be world-class businesses too. But generally speaking, the higher the FCF margins a business is able to produce, the better.
For fundamental investors, FCF margins (before growth investments) should be a critical indicator of business quality.
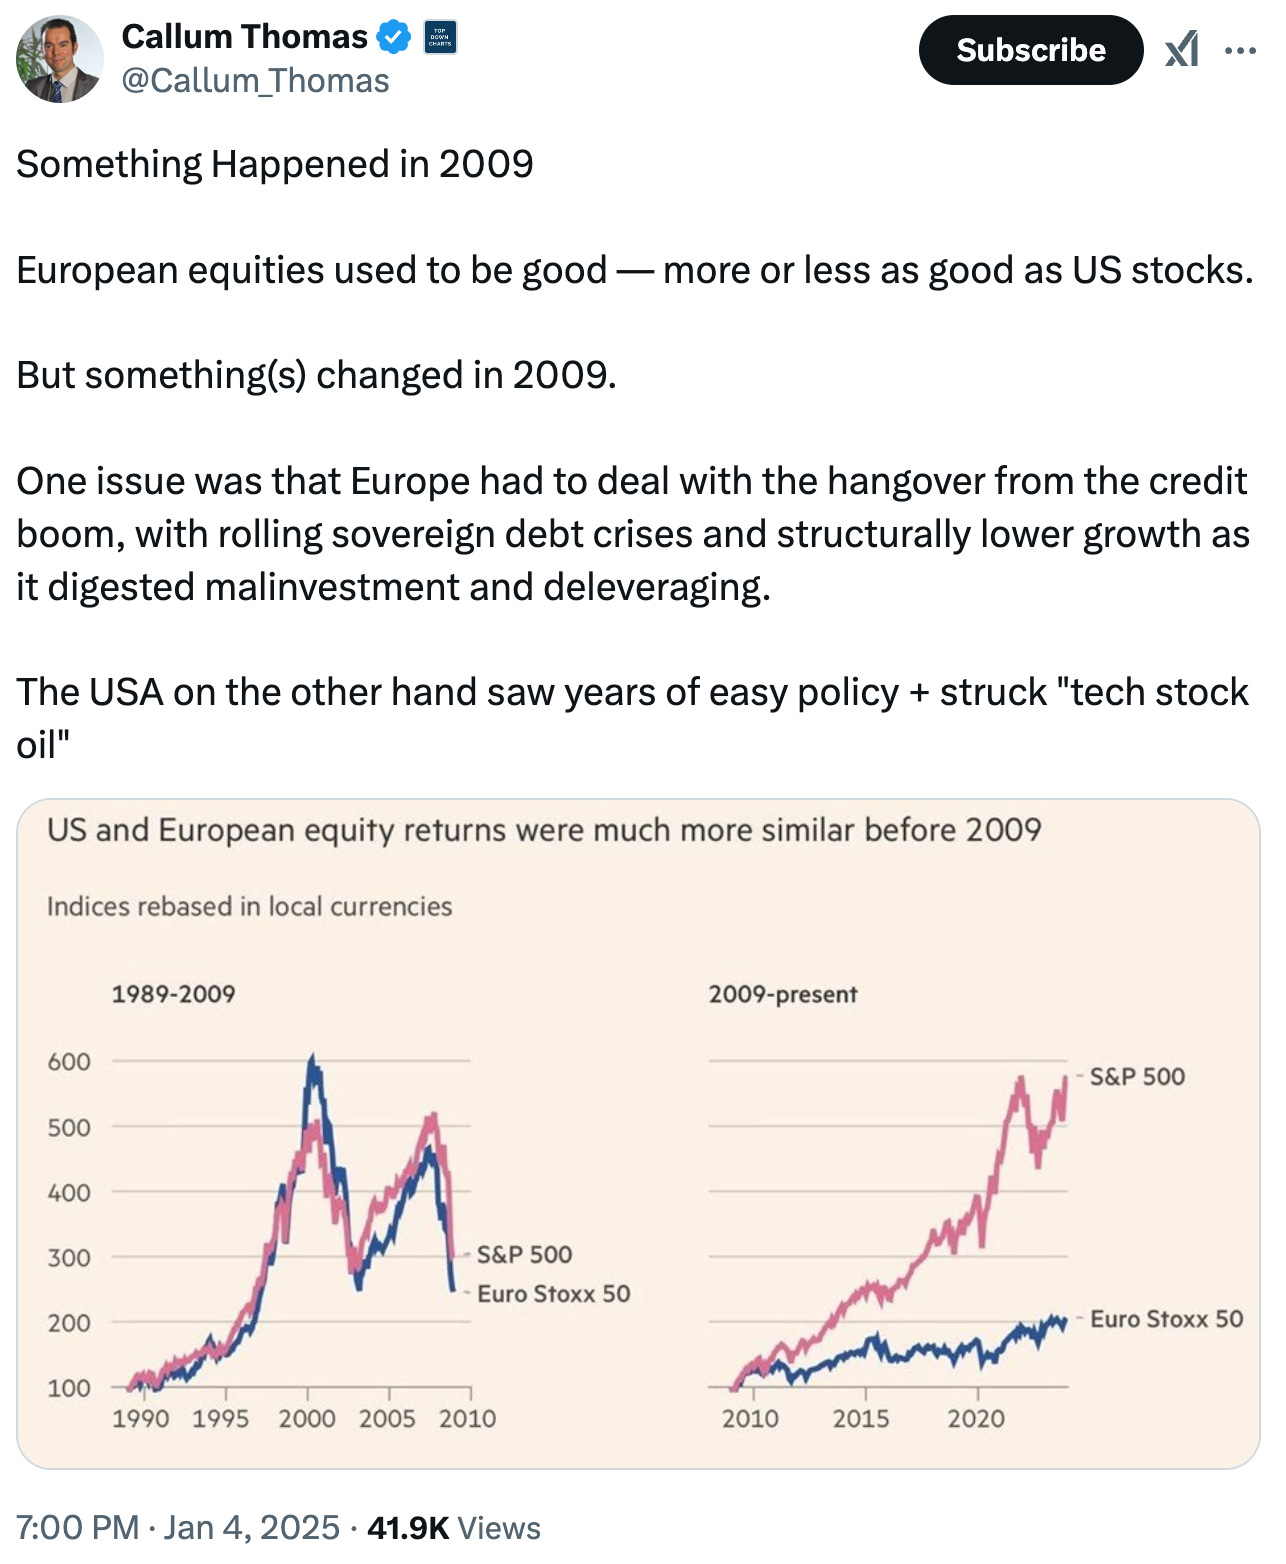
The improvement in FCF margins over decades reflects the transition of the US economy toward technology, intellectual property, and services—industries that require less capital investment and generate higher returns on equity. This shift helps justify the higher valuation multiples we see today and it partly explains why US stocks have massively outperformed their European counterparts in recent years.
Beyond Multiples: A New Growth Paradigm
Another key element of what an asset (or a group of assets) is worth—and valuation multiples being a shorthand for that—is growth.
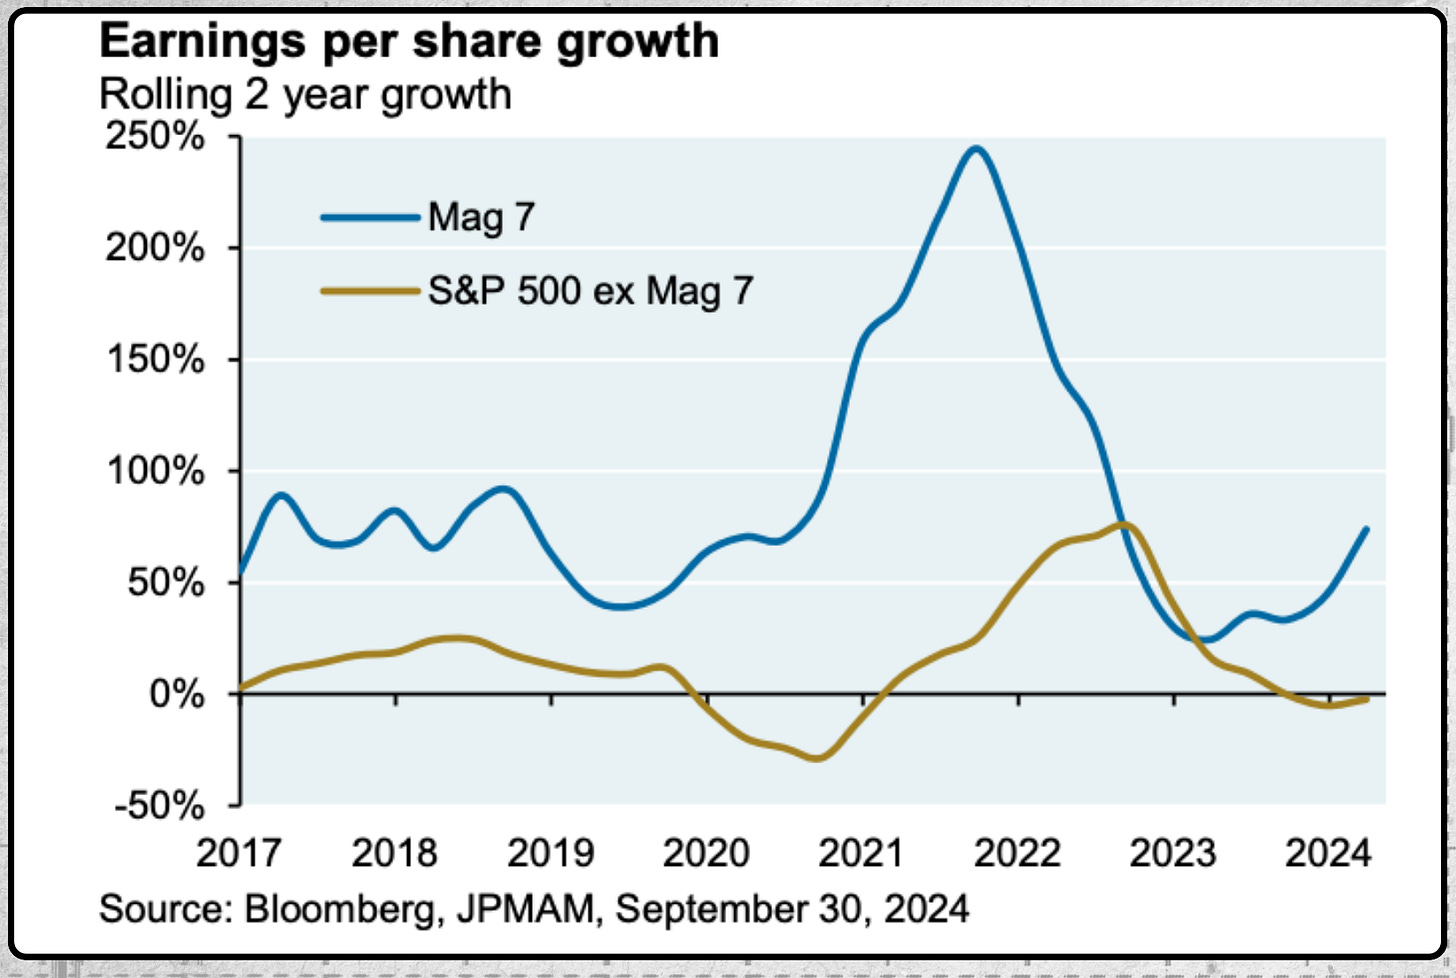
The S&P 500’s largest companies are not just more profitable—they’re growing faster than ever according to the aforementioned J.P. Morgan report.
The “Mag7” (a term for some of the largest companies in the index, including Apple, Microsoft, and Nvidia) have significantly outpaced the broader market in earnings per share (EPS) growth.
This growth isn’t just about expanding revenue—it’s about reinvesting strategically and improving the competitive position (and revenue diverisification) of these businesses. Modern companies often prioritize:
R&D investments to develop cutting-edge technologies.
Marketing and headcount expansion to capture market share.
Software and cloud infrastructure to drive recurring revenue models.
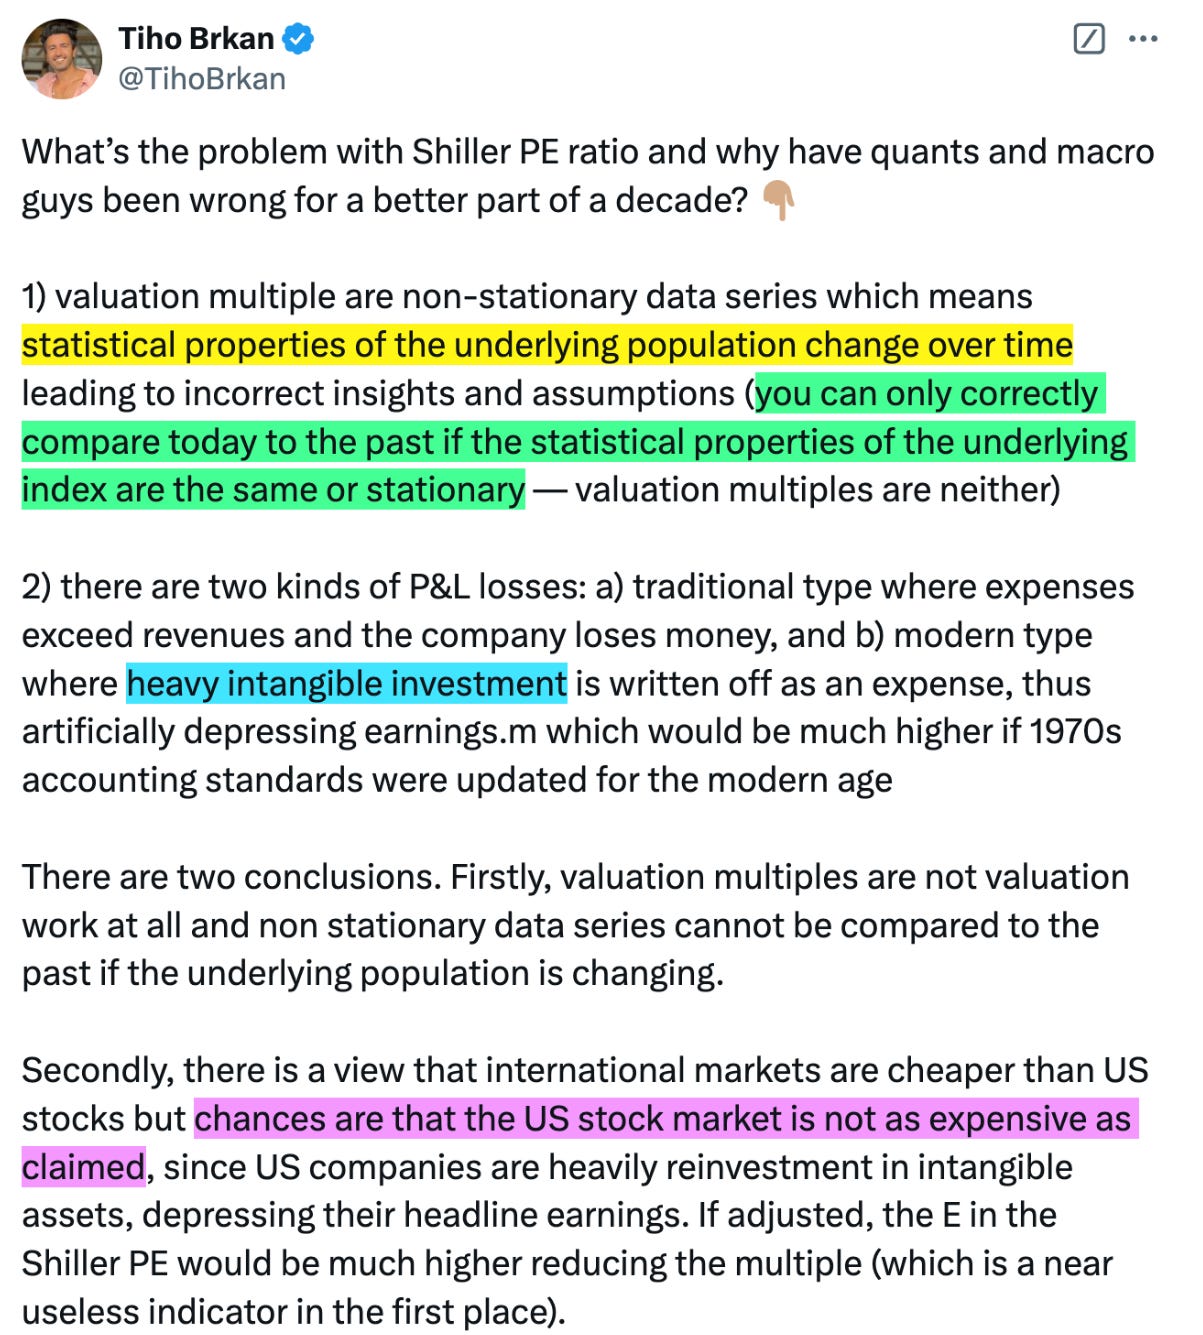
These investments are often expensed through the income statement, which can temporarily suppress earnings but fuel long-term growth.
This contrasts with historical reinvestment strategies, which were more focused on physical assets like factories and machinery.
Why Historical Comparisons Are Misleading
It’s tempting to compare today’s P/E ratios to those of decades past, but doing so ignores a critical point: the underlying statistical properties of the S&P 500 have changed.
You cannot compare the P/E ratio of the S&P 500 in the 1950s to that of today because the statistical properties of the underlying population have changed.
What Else Is Different About Today’s Market?
Composition of the Index: As already mentioned, the S&P 500 is now dominated by tech-driven, asset-light companies with high margins and scalable business models. Compare this to the manufacturing-heavy index of the past, and the difference is stark.
Global Reach: Moreover, many of today’s largest companies derive a significant portion of their revenue from international markets, making them less dependent on domestic economic cycles.
Structural Growth Trends: Cloud computing, artificial intelligence, and digital payments are driving secular growth trends that were unimaginable in the mid-20th century.
Reframing “Overvaluation”
Let’s revisit the argument that the S&P 500 is “wildly overvalued.” Critics often point to the high P/E ratio as evidence, but they fail to account for:
Higher Free Cash Flow Margins: A company generating 25%-60% FCF margins deserves a higher multiple than one generating 10%.
Faster Growth Rates: Growth is a critical component of valuation. Companies growing EPS at double-digit rates warrant higher valuations.
Improved Quality of Earnings: Today’s earnings are less dependent on cyclical industries and more driven by stable, recurring revenue streams.
Economic Moats: Many of today’s largest companies have wide(r) moats—sustainable competitive advantages that protect their profitability and market position.
So, is the S&P 500 overvalued? The answer depends on how you interpret the data. If you focus solely on P/E ratios and historical comparisons, the valuation of the S&P 500 appears stretched. But if you consider the improved quality, profitability, and growth potential of its largest components, the picture changes.
Elevated multiples may not signal overvaluation—they might reflect the new normal (and they have so for the past ten years) for a market dominated by higher-quality businesses.
Final Thoughts: A Case for Nuance
Labeling the S&P 500 as overvalued without context ignores the transformation of the US economy and the structural changes in the index. The higher multiples we see today could be justified by:
Superior cash generation capabilities.
Robust growth prospects.
A fundamental shift in how businesses reinvest for the future.
What do you think? Are today’s elevated valuations a sign of a stronger market, or are we overlooking warning signs of a potential correction? Let’s discuss in the comments below.
Until next time, happy investing!




good one rené
Interesting. Correcting the FCF for SBC might change the picture.